Bonjour, je suis Mathieu.
Designer et artiste en visualisation de données.

Je travaille et joue avec les données, le design d'information, pour le plaisir et pour des projets clients.

MES PROJETS

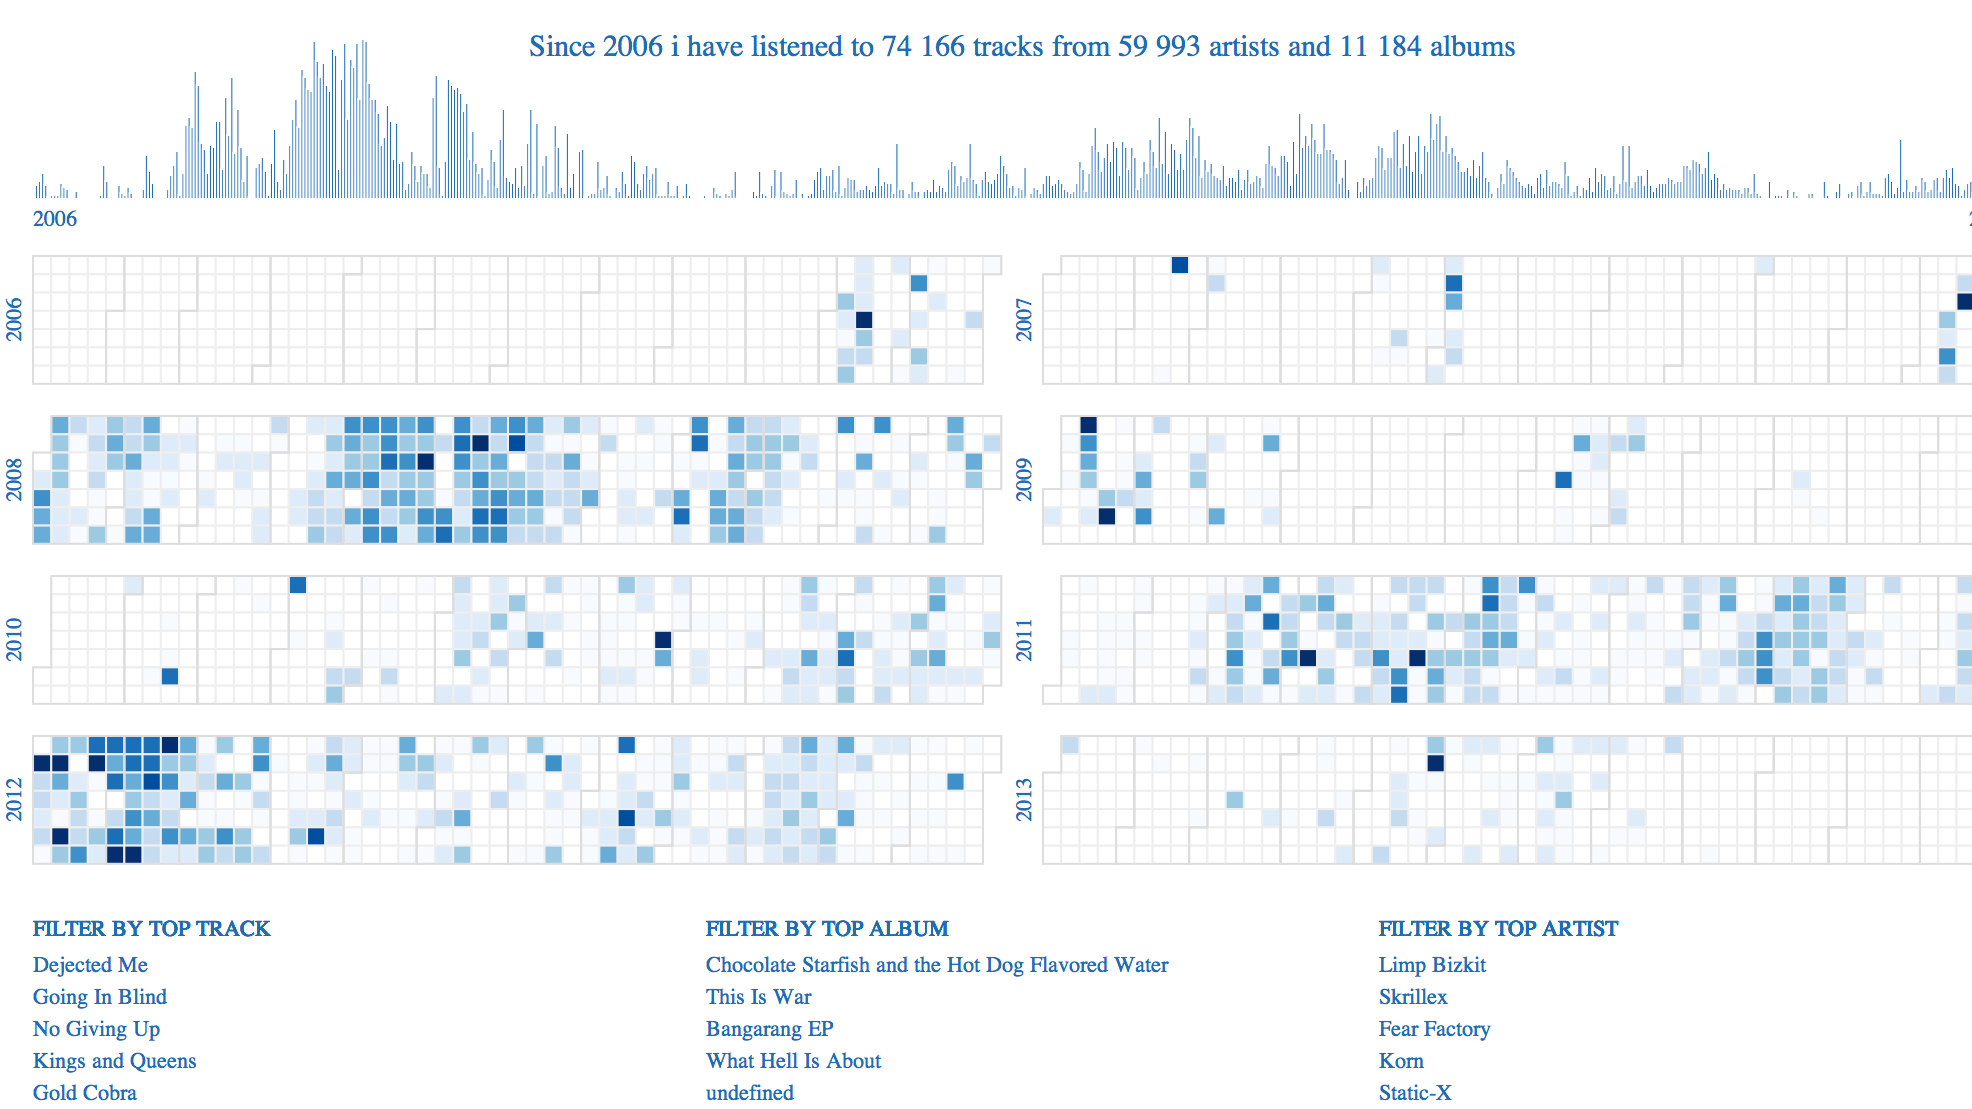
Last.fm listening history: a bar chart timeline and year-by-year calendar heatmaps of tracks played from 2006 to 2013
LASTFM LISTENING HISTORY
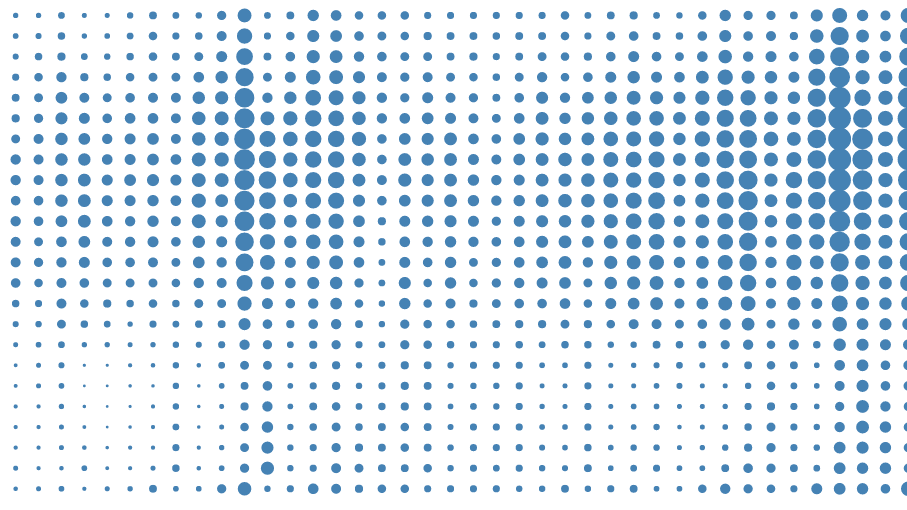
Bordeaux weather: a dot-matrix heatmap where the size of each dot encodes the measured value
BORDEAUX METEO
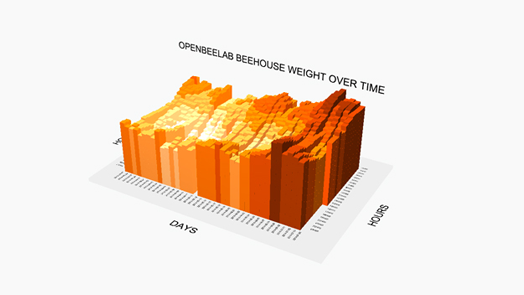
Beehive weight over time: a 3D bar chart with one column per day and one bar per hour
BEEHIVE WEIGHT
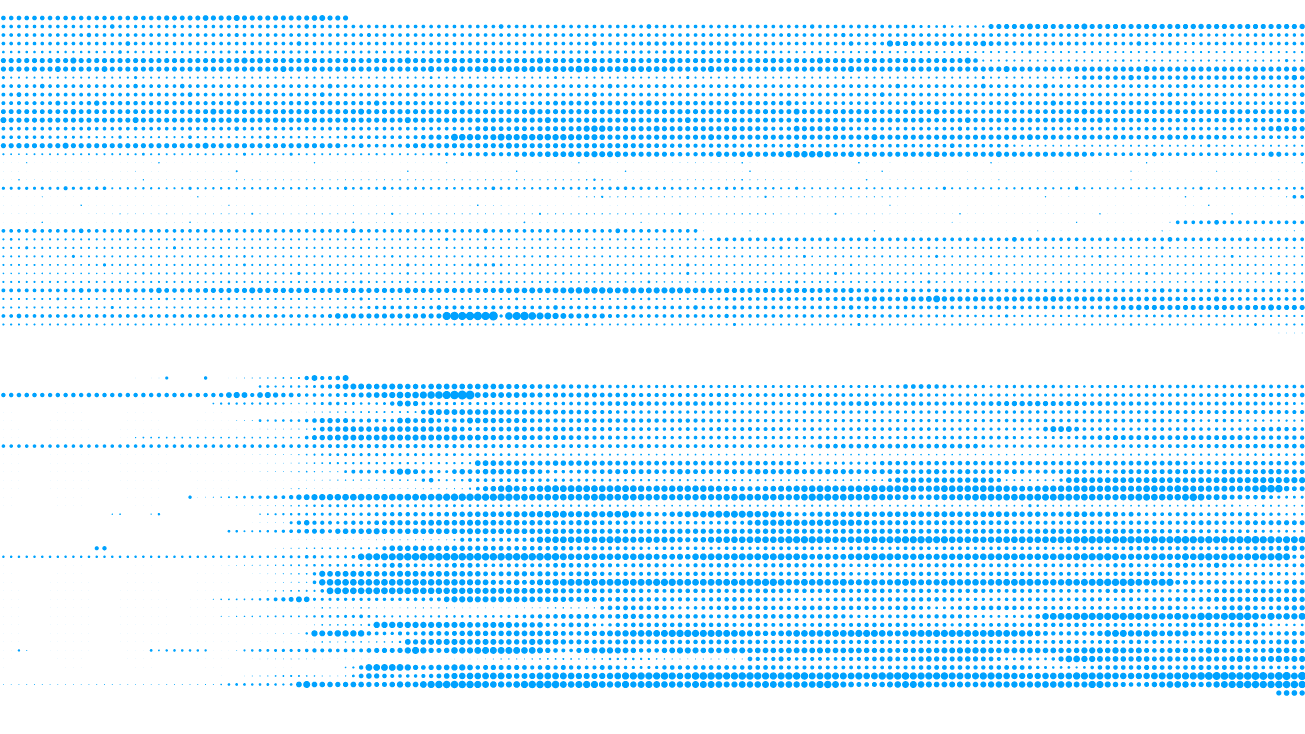
Light sensor readings at home: a dot matrix where the size of each dot encodes the measured brightness
LIGHT SENSOR
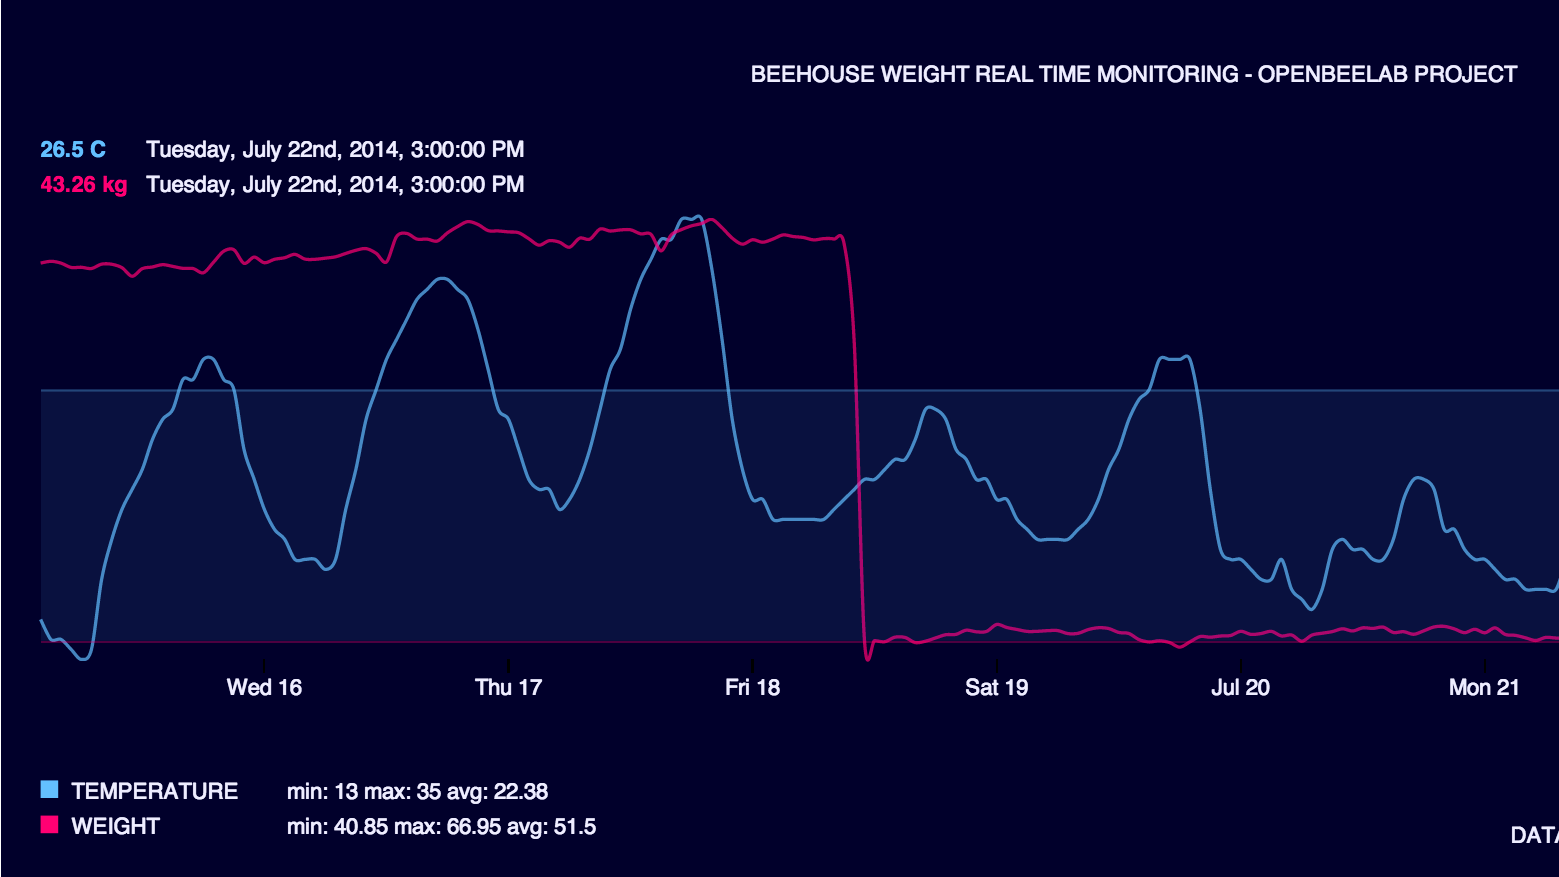
Realtime beehive monitoring: line charts of temperature and weight for the OpenBeeLab project
REALTIME BEEHIVE
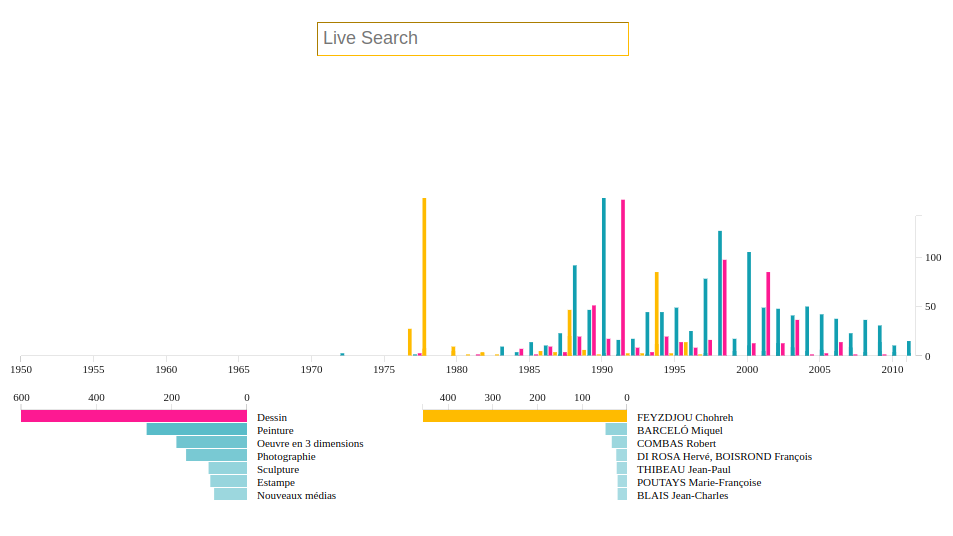
CAPC museum open data: acquisitions per year since 1950, with rankings by artwork type and by artist
CAPC OPEN DATA