Hello, I'm Mathieu.
A data visualization designer and artist.

Working and playing with data, information design, for fun and clients projects.

MY WORK

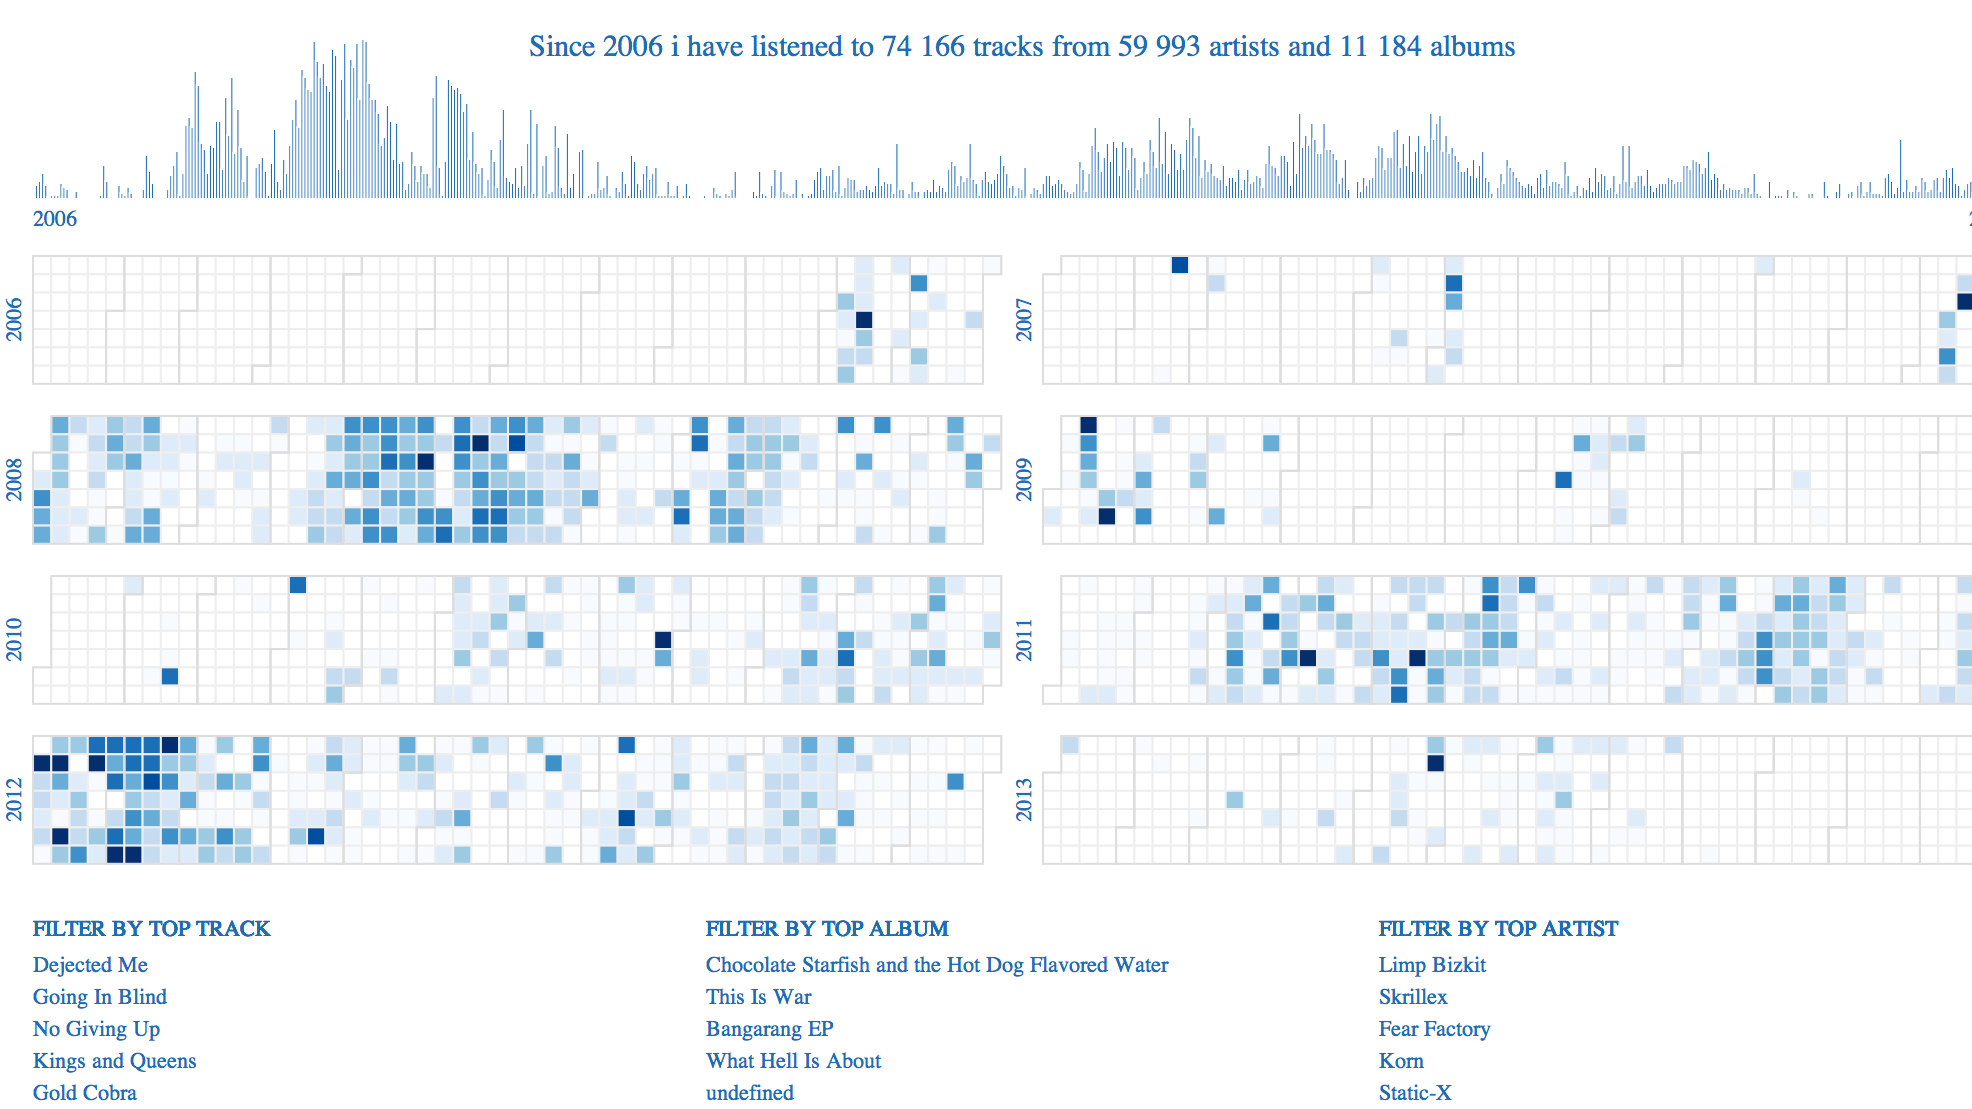
Last.fm listening history: a bar chart timeline and year-by-year calendar heatmaps of tracks played from 2006 to 2013
LASTFM LISTENING HISTORY
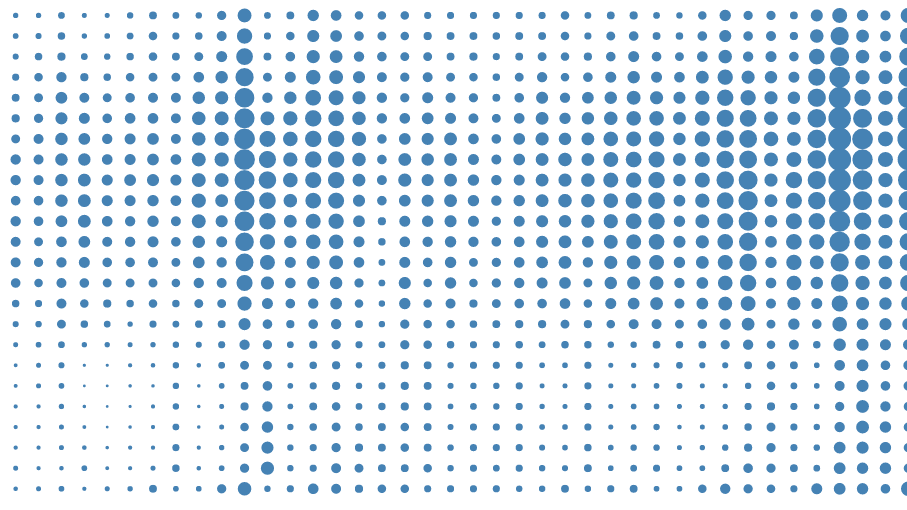
Bordeaux weather: a dot-matrix heatmap where the size of each dot encodes the measured value
BORDEAUX METEO
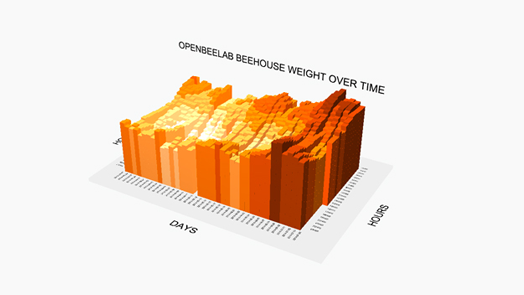
Beehive weight over time: a 3D bar chart with one column per day and one bar per hour
BEEHIVE WEIGHT
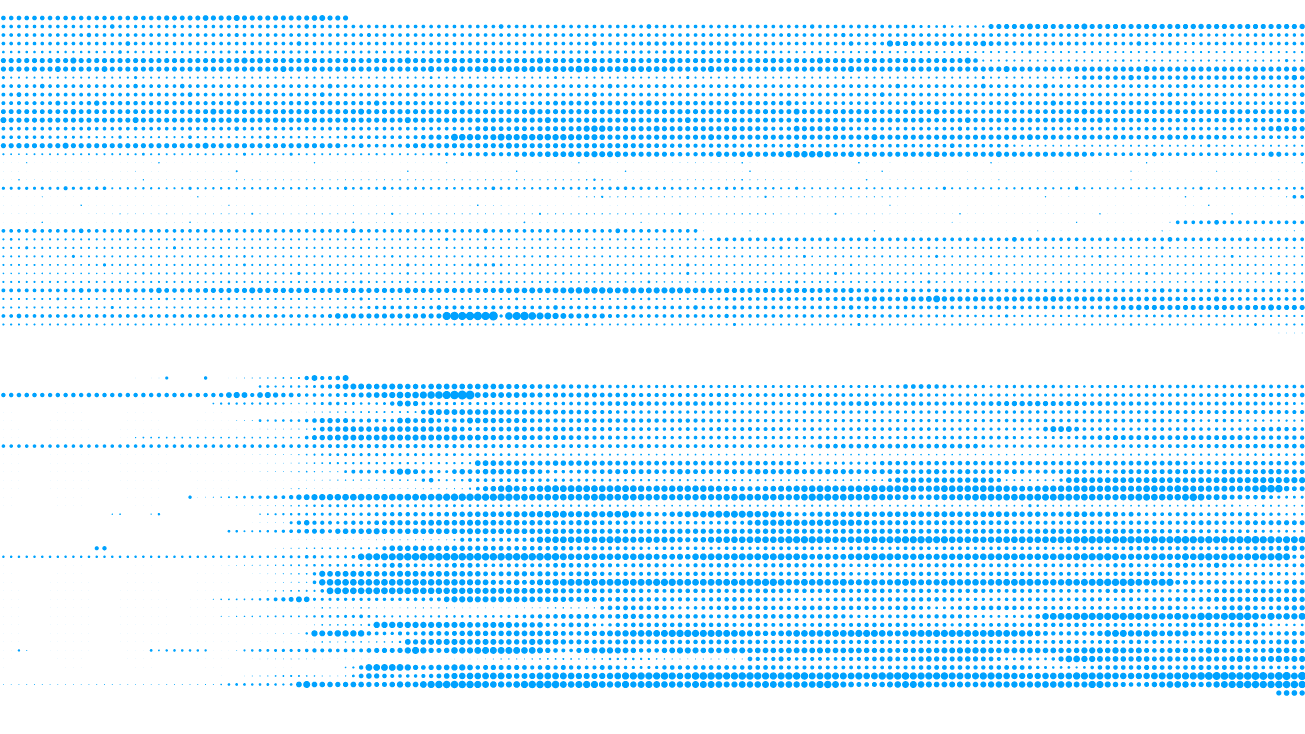
Light sensor readings at home: a dot matrix where the size of each dot encodes the measured brightness
LIGHT SENSOR
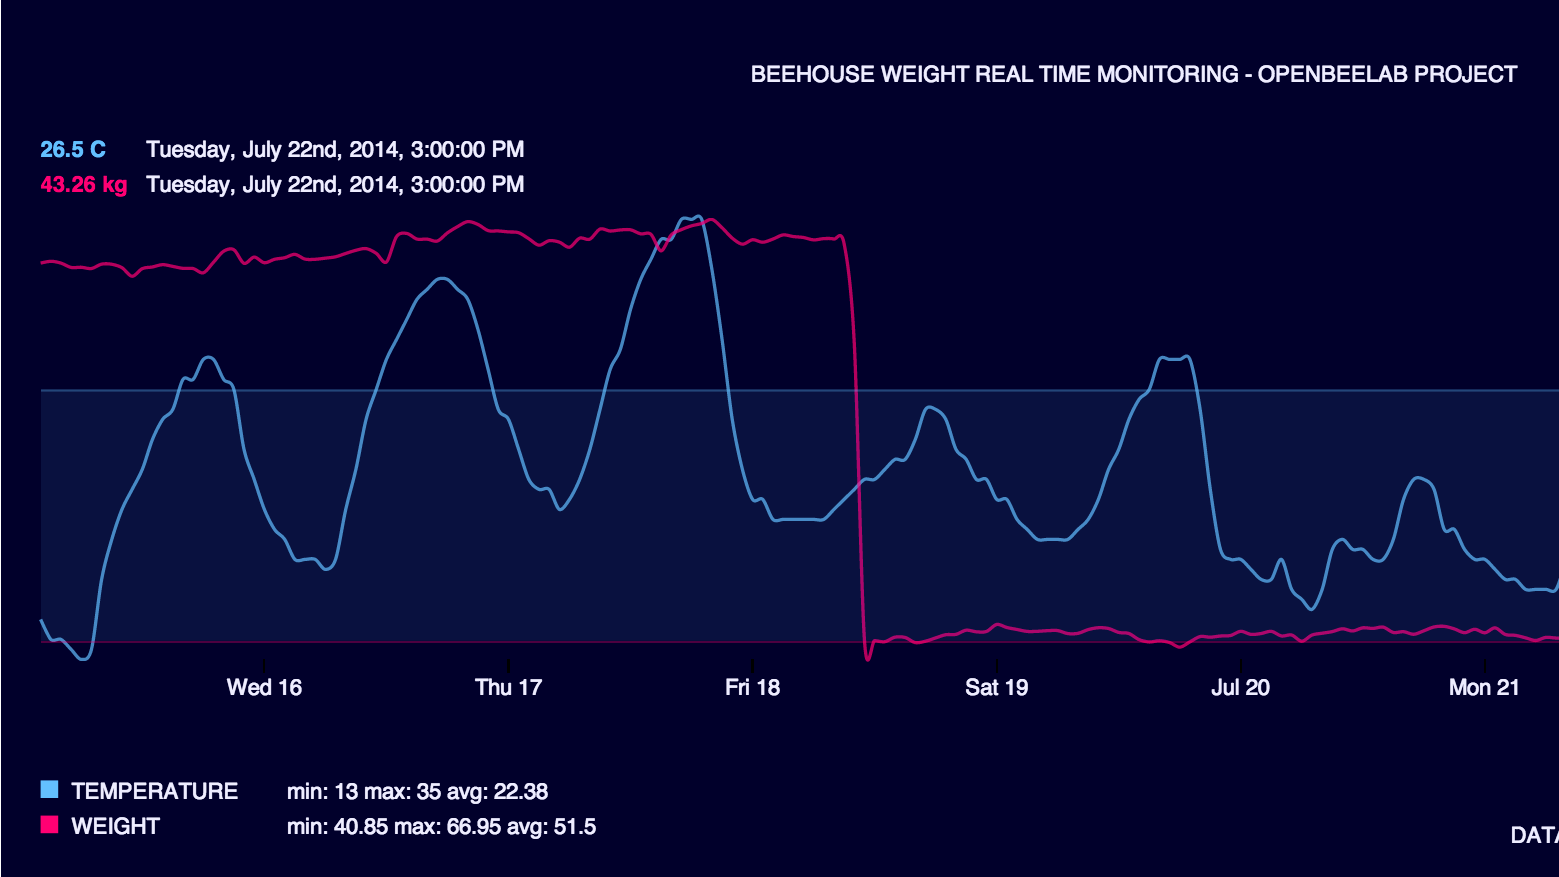
Realtime beehive monitoring: line charts of temperature and weight for the OpenBeeLab project
REALTIME BEEHIVE
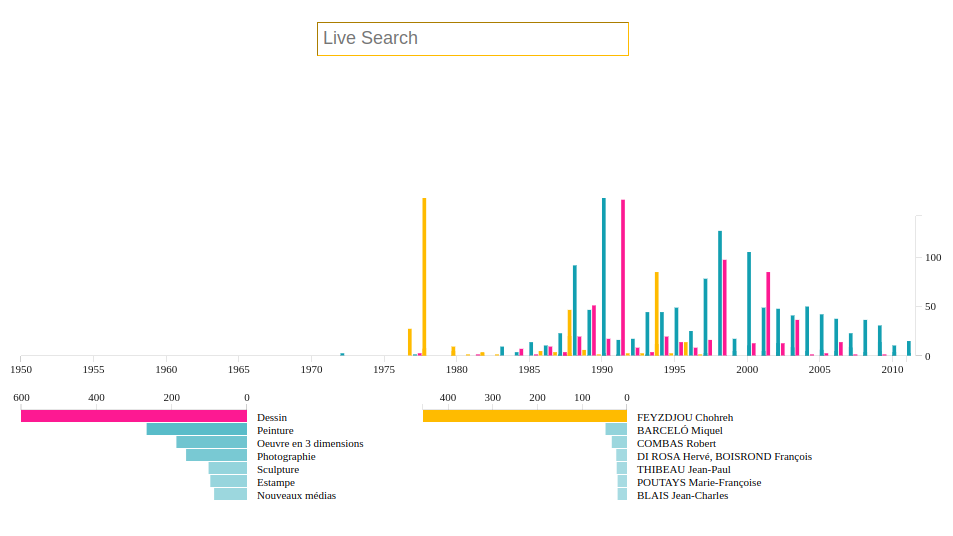
CAPC museum open data: acquisitions per year since 1950, with rankings by artwork type and by artist
CAPC OPEN DATA