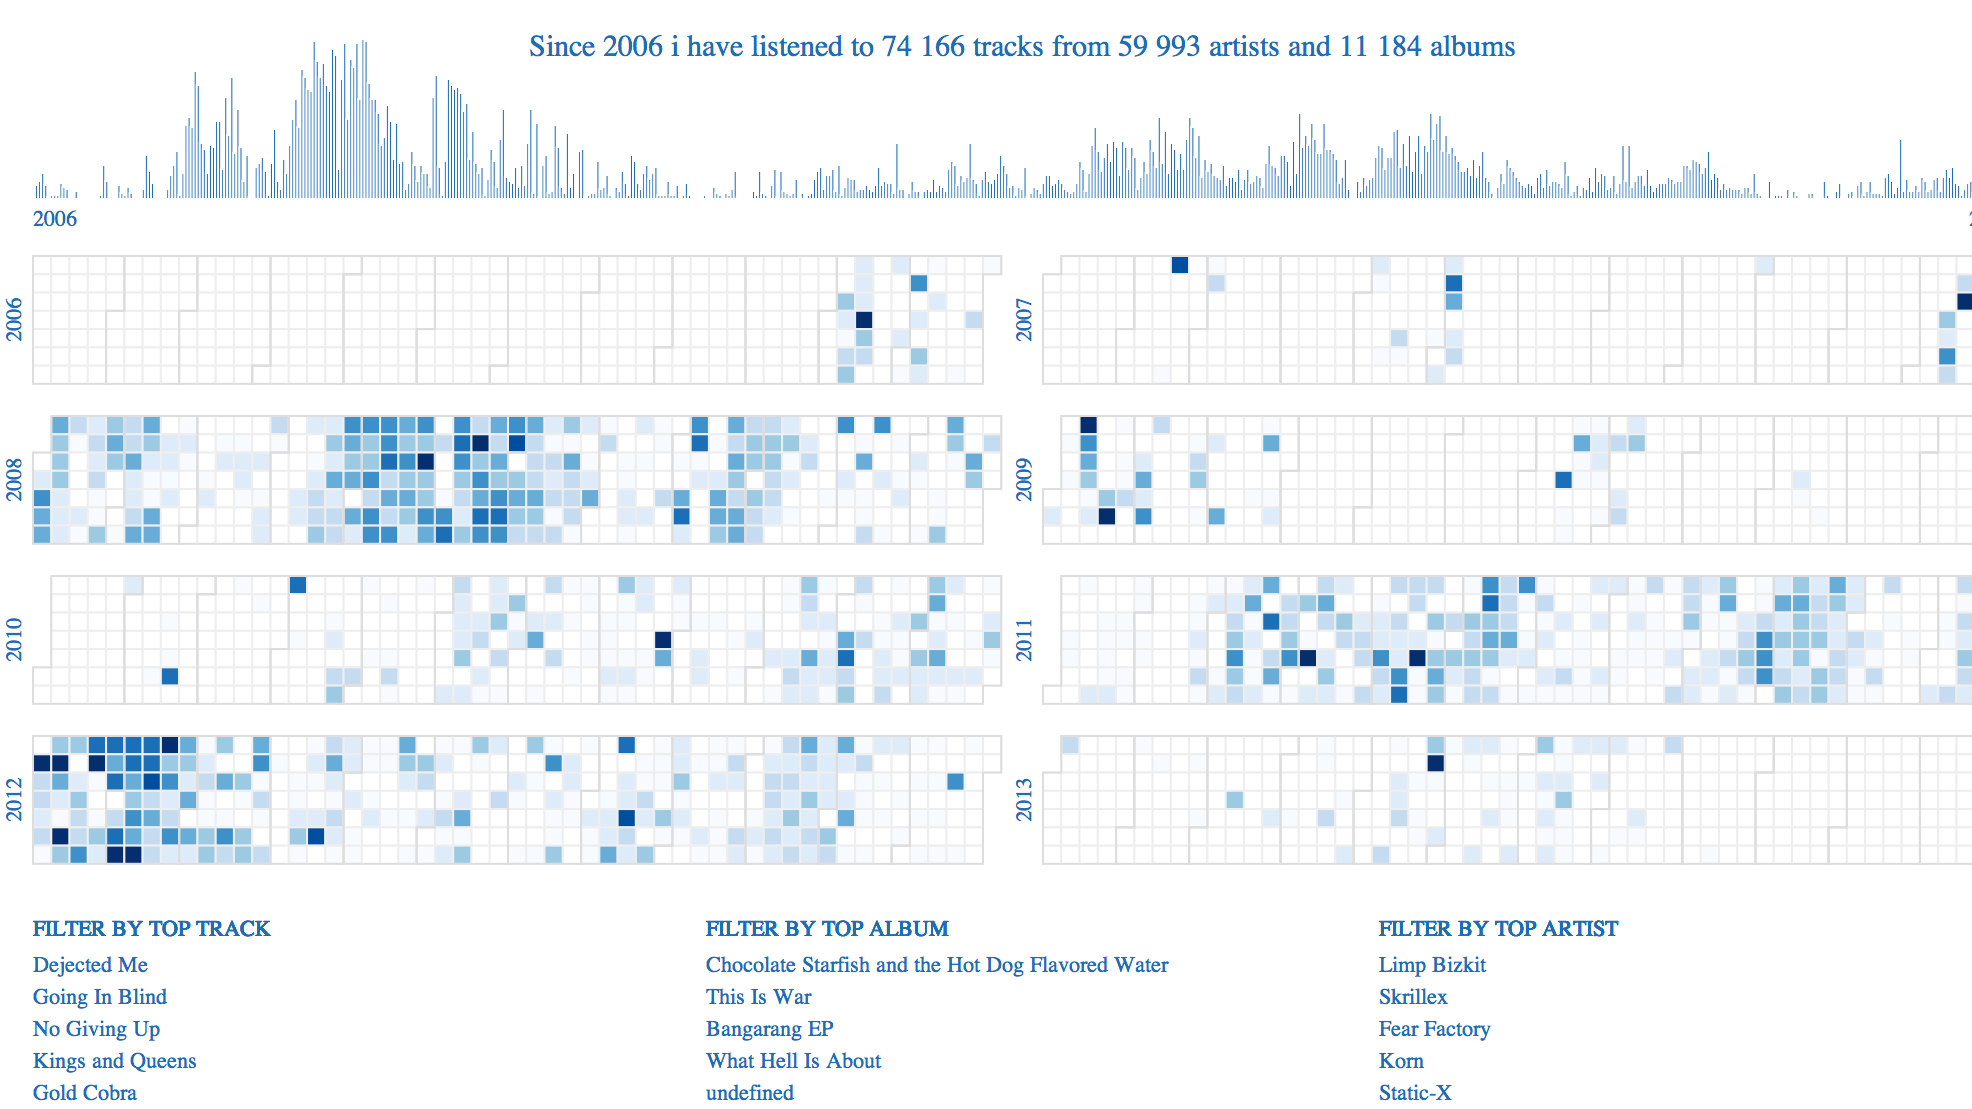
LASTFM LISTENING HISTORY

BORDEAUX METEO
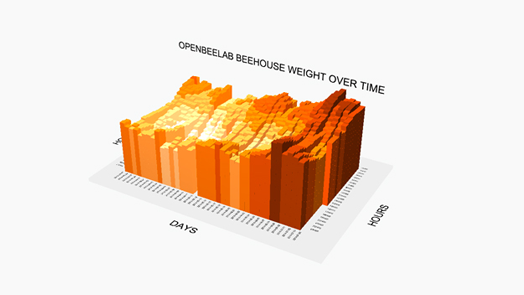
BEEHIVE WEIGHT
LIGHT SENSOR
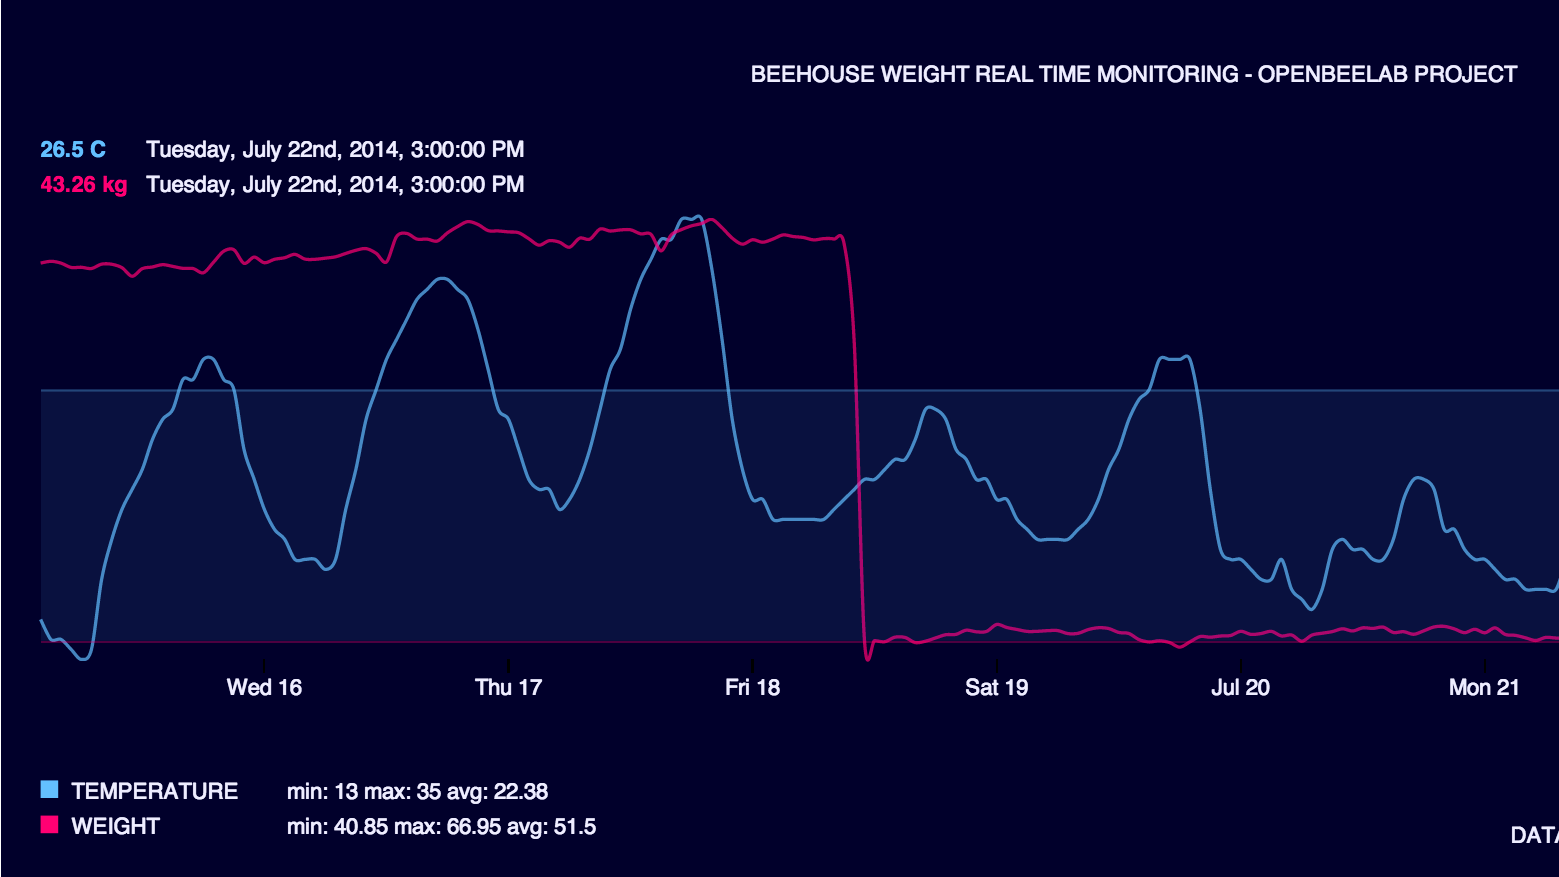
REALTIME BEEHIVE
Data comes from a beehive monitoring service. I extract beehive weihght over time. Each data point is the average weight for one hour.
Each bar is the beehive weight for one hour. Each column is a day.
This 3d visualisation in browser is zoomable. The camera can be rotated with the mouse.
html, css, javascript, three.js, d3.js.
This 3d histogram show evolution of a beehouse weight over days and hours. We see the beehouse weighting less during the day.
3d visualisation is not suitable for every type of data but sometimes it can be really effective... and fun !