DATA
Data comes from a light sensor, logged on an arduino with a sd storage.
VISUALIZATION ENCODING
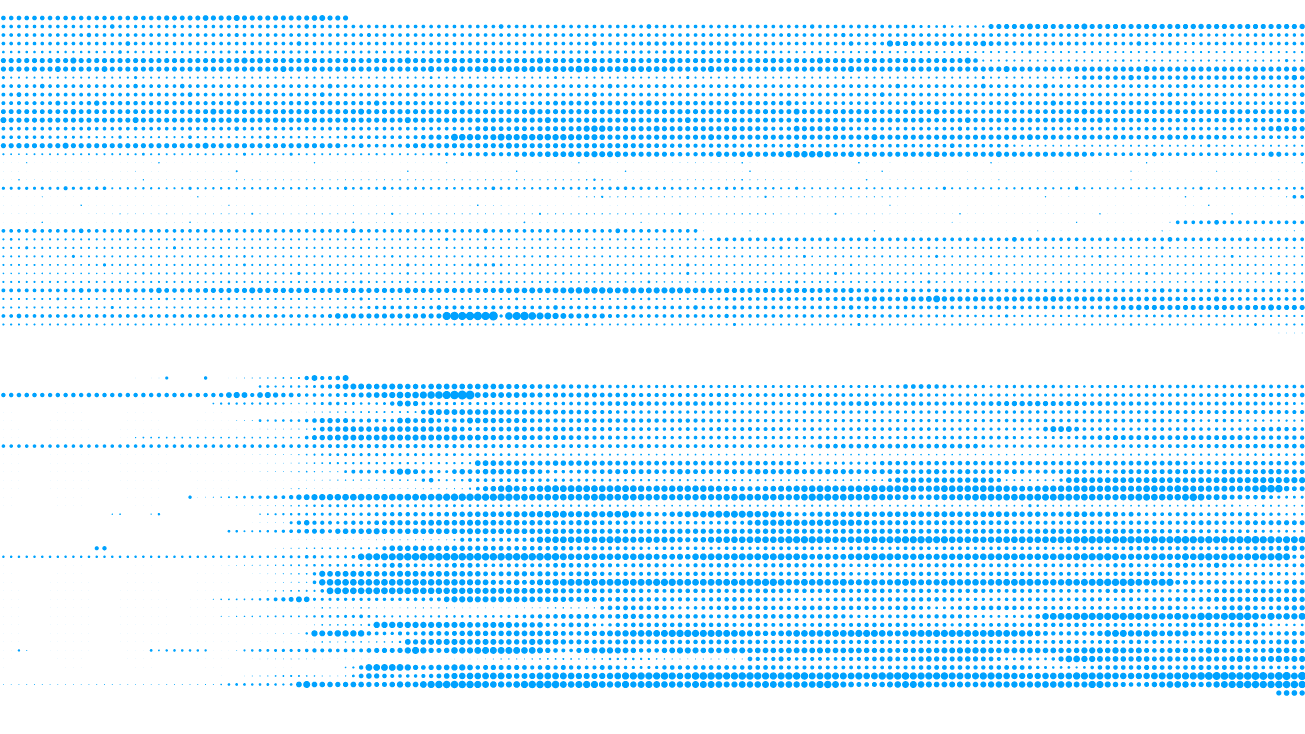
Each point is the light intensity for one seconde. Each line is a day.
VISUALIZATION INTERACTION
No interaction, visualisation is static.
TECHNOLOGIES
html, css, javascript, d3.js, arduino, electronics.
STORY
Light sensor is shown over time, days and each seconds.
There is a lot of data points but we can see when the light is open during the night, or when i wake up...
Thats what is amazing with visualization: the user own the data context and add information to the visual one.